
jueves, 23 de abril de 2015
miércoles, 22 de abril de 2015


jueves, 16 de abril de 2015


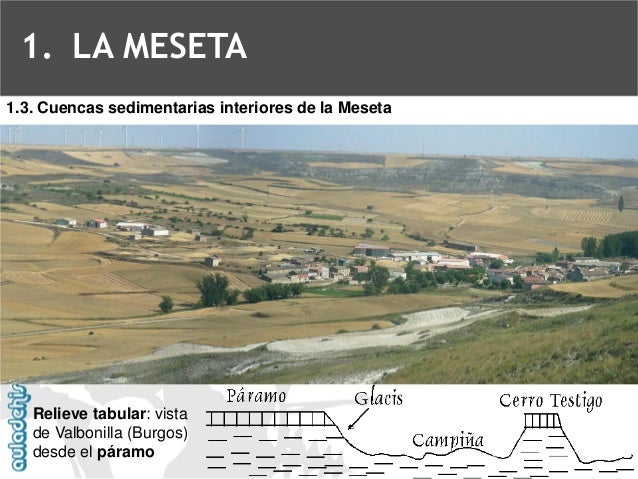
PISOS BIOCLIMÁTICOS DE ESPAÑA

Mapa de los pisos bioclimáticos de España según Rivas Martínez (1987).

miércoles, 15 de abril de 2015
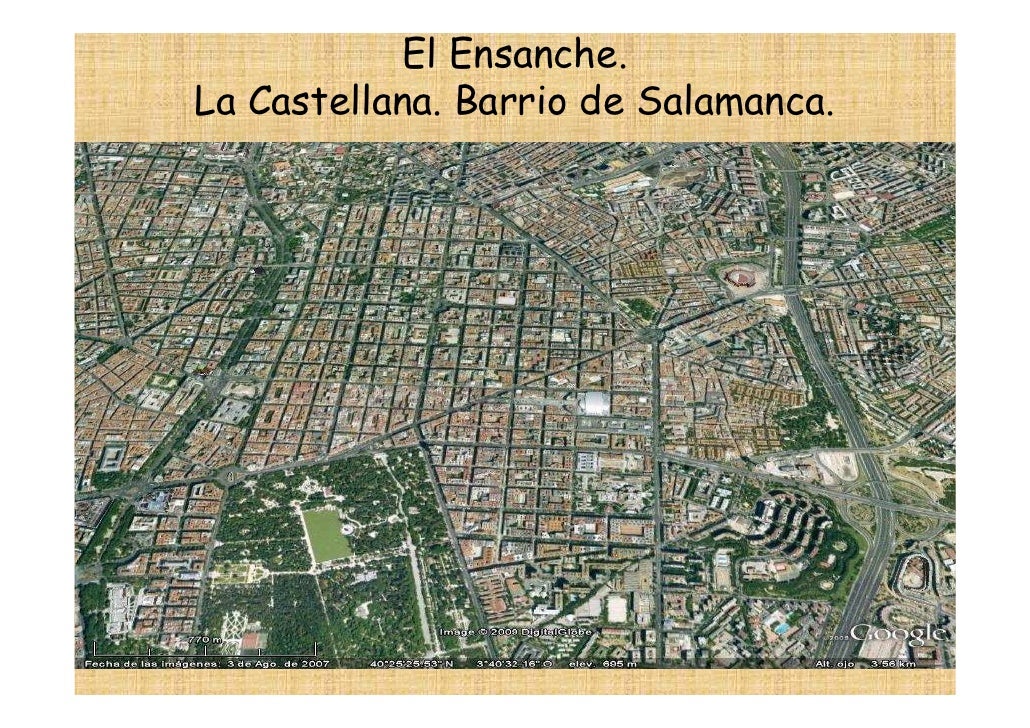
PLANO URBANO CENTRO DE MADRID

Imagen aérea vertical del PNOA del centro urbano de Madrid (España).
PNOA © Instituto Geográfico Nacional de España (Comunidad de Madrid)


Population distribution and density
Population distribution and density
Population distribution means the pattern of where people live. World population distribution is uneven. Places which are sparsely populated contain few people. Places which are densely populated contain many people. Sparsely populated places tend to be difficult places to live. There are several natural and human factors that affect favoured conditions:
fertile valleys
a regular suply of water
a climate which is not too extreme
good communications
stable governments
good job opportunitiesAreas of high population density tend to be located between 20° and 60°N. This area contains a large land area and a relatively temperate climate.
Population density is a measurement of the number of people in an area. It is an average number. Population density is calculated by dividing the number of people by area. Population density is usually shown as the number of people per square kilometer. As you can see in the following map there are densely populated areas and desertical areas:

Evolution of world's population
Population growth refers to change in the size of a population—which can be either positive or negative—over time, depending on the balance of births and deaths. If there are many deaths, the world's population will grow very slowly or can even decline.
The world population has grown tremendously over the two past centuries, but before this situation was not the same.
Evolution of world's population
Until about 1750 population grew very slowly because there was a counterbalance between high mortality and high fertility. At the dawn of the first millennium world's population was around 300 million people due to a long period of stationary growth. In the next years population grew slowly and we have estimated it was around 800 millon in 1750. World's population was kept in check by high death rates due to the combined effects of plagues, famines, unsanitary living conditions, and general poverty. For example, we could mention that european population even fell in the 1300s -killed by the Black Death.
By the mid 18th century living conditions changed in western Europe due to the Industrial Revolution, and population began to grow substantialy: by 1950 it had tripled to around 2.5 billion people. The use of antibiotics and other public health advances worldwide allowed a more dramatical increase: by 1985, the human population was 5 billion. By 2000 global population was 6 billion ant is projected to be 9 billion in 2050. Link

The Demographic Transition Model
The Demographic Transition Model (DTM)
This is a theory born in the first years of the 20th century that tries to describe the relationship between population's growth and economic increase, and the assessment that every country is in one of the different stages that we can study.
It states that in world's population history we can distinguish 5 stages:
Stage 1. High stationary: both birth rate and death rate high. Population increase is slow and fluctuates. There is no country at this stage, but some indigenous tribes.
Stage 2. Early expanding: birth rate stays high, but death rate falls rapidly. Population grows quickly. Life expectancy increases. Countries like Afghanistan, Sudan, and Lybia are in this stage.
Stage 3. Late expanding: birht rate falls and death rate stays at low level. Population growth rate rapid at first, then slows. Countries like Brazil and Argentina are in this stage.
Stage 4. Low stationary: birth and death rates are low. Population is stable or grows very slowly. Developed countries are in this stage.
Stage 5. Low declining: low birth rate with elderly population go to a declining population. Japan and Sweden are in this stage.

martes, 14 de abril de 2015


lunes, 13 de abril de 2015
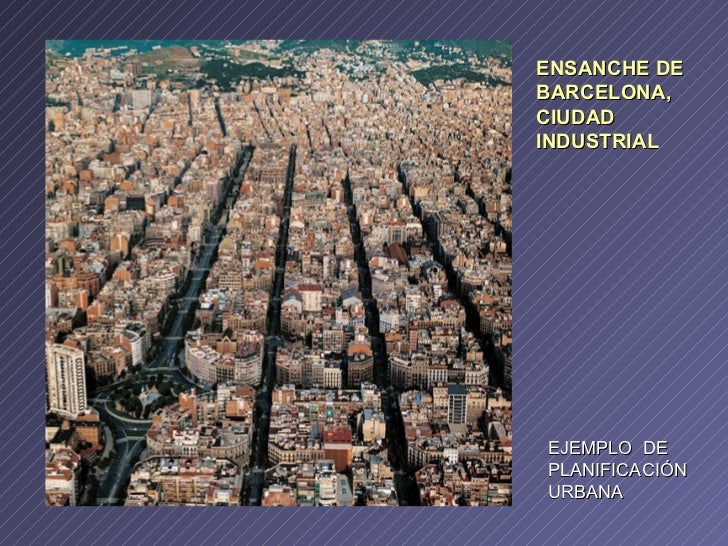
PAISAJE URBANO BARCELONA
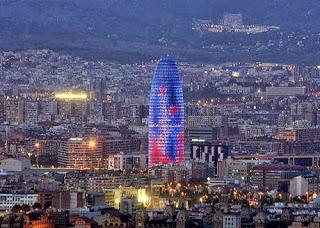
Fuente: http://m1.paperblog.com/i/211/2111606/5-maravillas-barcelona-L-H2ggvY.jpeg


jueves, 9 de abril de 2015
PLANO URBANO DE PAMPLONA. ANÁLISIS.

3. La figura siguiente es un fotoplano de la ciudad de Pamplona. Analícelo y conteste a las preguntas siguientes: a) Identifique, mediante el correspondiente número (o números)las siguientes unidades: Alcázar, centro histórico y ensanches. b) Defina el tipo de plano de las unidades morfológicas correspondientes a los números* 5, 2, 3 y 4. c) Explique los factores del emplazamiento de la ciudad de Pamplona, en relación con el medio natural.
El mapa representa la distribución geográfica de las aglomeraciones urbanas en España.

2. El mapa representa la distribución geográfica de las aglomeraciones urbanas en España. Con la información que contiene responda a las siguientes preguntas: a) Diga el nombre de las ciudades que tienen más de 500.000 habitantes.b) ¿Cómo llamaría usted al eje urbano número 3?. Diga el nombre de las Comunidades Autónomas afectadas por dicho eje urbano.c) Explique los condicionantes geográficos que favorecen la bifurcación en dos ramas del eje urbano andaluz.
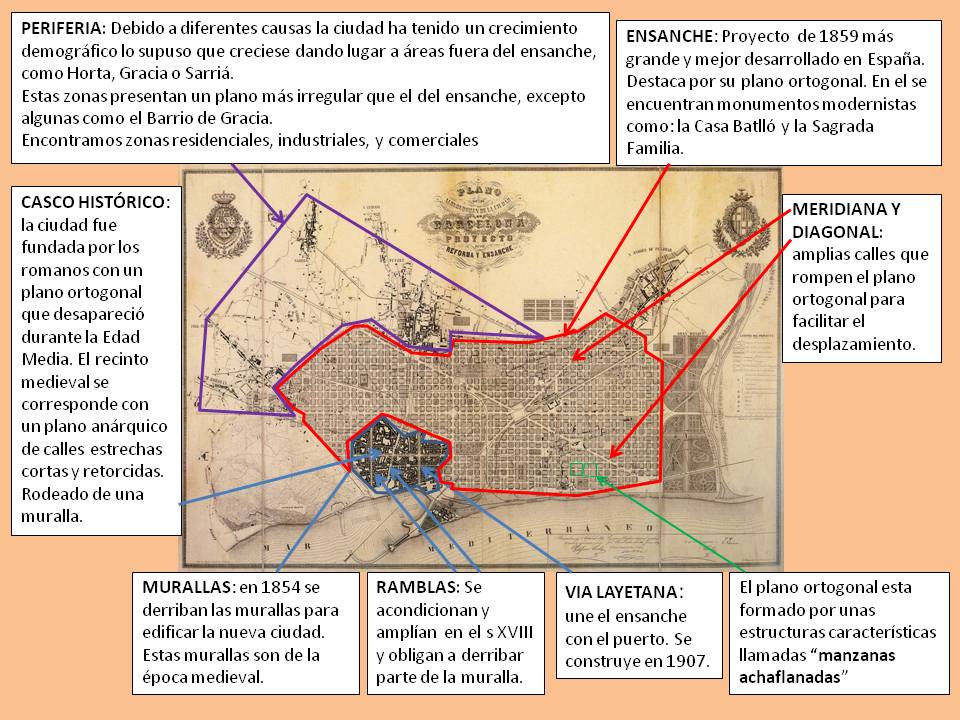
Ejercicio práctico plano urbano Barcelona

b) Defina el tipo de plano de las unidades morfológicas correspondientes a los números 1, 3 y 4, y diga qué peculiaridades tiene el ensanche y quién es su autor principal.
c) Explique los factores de la localización de la ciudad de Barcelona, en relación con el medio natural.
Suscribirse a:
Entradas (Atom)